Financial Highlights
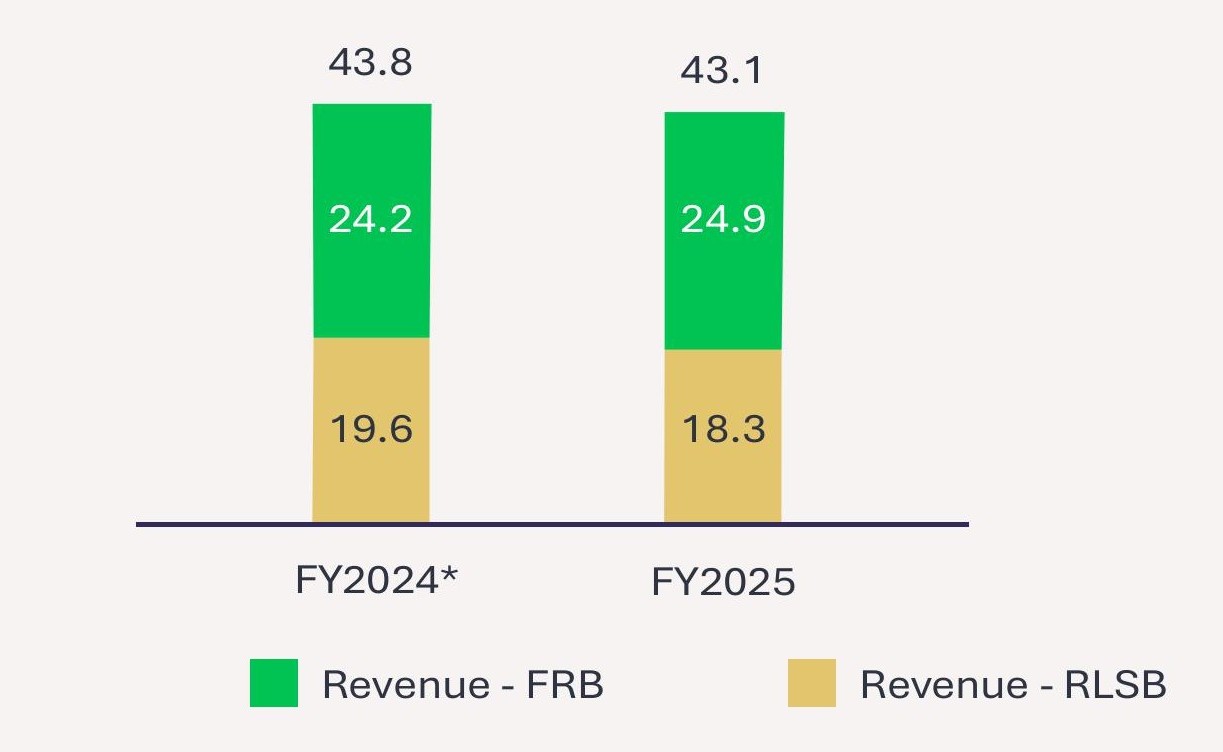
Revenue By Segment
Unit: S$ mln
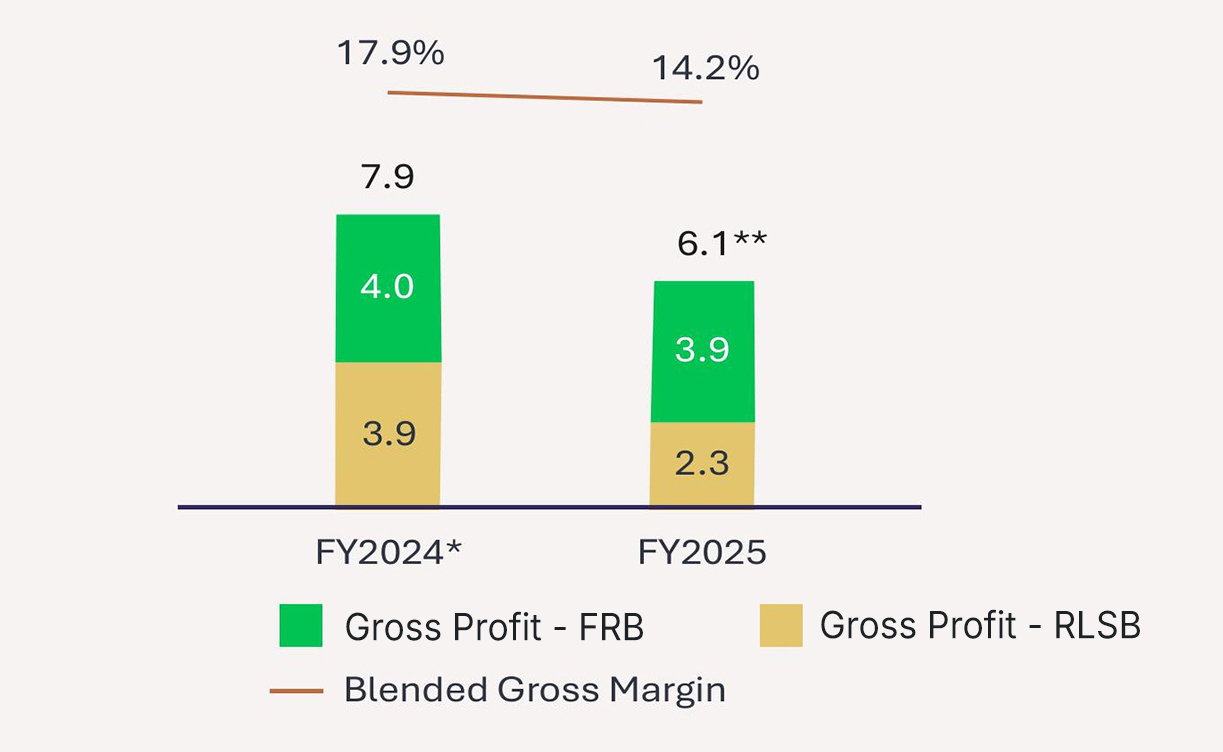
Gross Profit By Segment
Unit: S$ mln
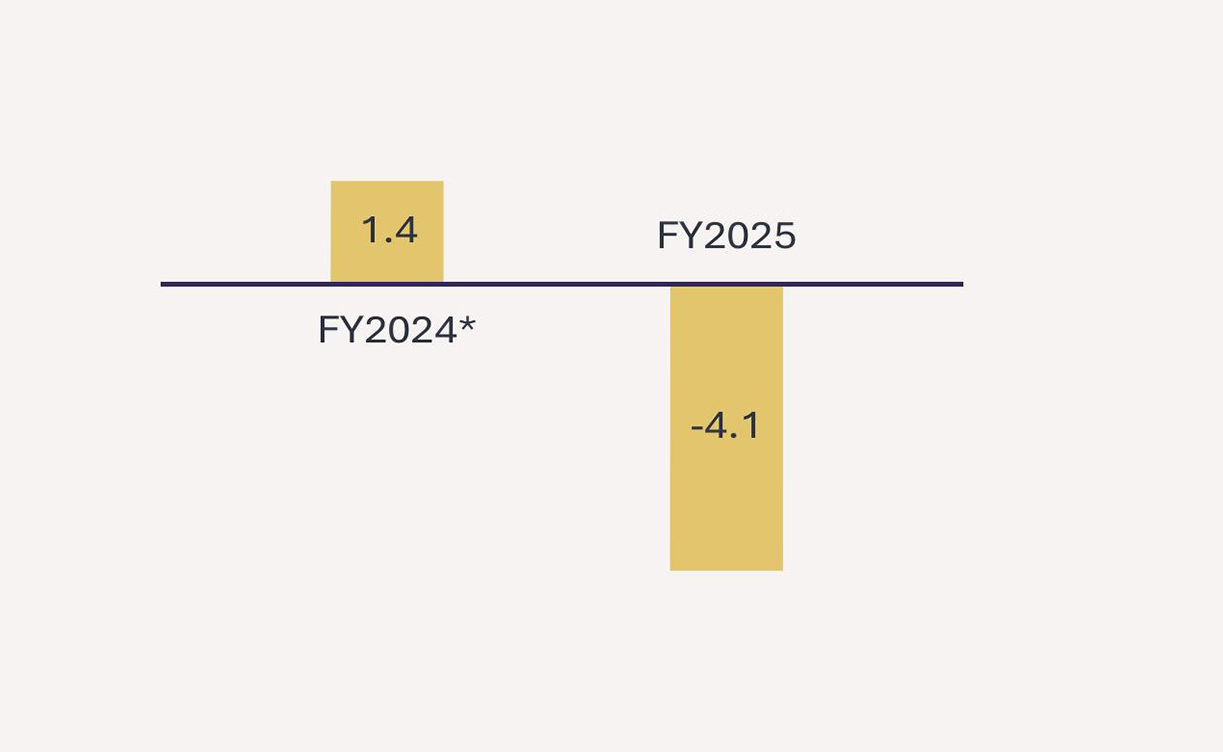
Profit / (Loss) For The Year
Unit: S$ mln
FRB = Food Retail Business; RLSB = Restaurants Leasing and Subleasing Business
*FY2024 results included gains from the sale of subleased properties, as well as revenue from Food Innovators Taiwan Co., Ltd. and Kurimen, Co., Ltd., which were divested in FY2024.
** Total figures may have some discrepancies due to rounding.
| Fiscal Year | 2024 S$'000 |
2025 S$'000 |
|---|---|---|
| Revenue | 43,773 | 43,136 |
| Cost of sales | (35,920) | (36,997) |
| Gross profit | 7,853 | 6,139 |
| Other income | 2,912 | 555 |
| Administrative and distribution expenses | (6,971) | (7,173) |
| IPO listing expenses | - | (2,940) |
| Other expenses | (595) | (44) |
| Finance costs | (780) | (775) |
| Share of losses from equity-accounted for associate | (91) | (17) |
| (Loss)/Profit before income tax | 2,328 | (4,255) |
| Income tax benefit/(expenses) | (923) | 122 |
| (Loss)/Profit for the financial year | 1,405 | (4,133) |
| Other comprehensive income/(loss): | ||
| Items that may be reclassified subsequently to profit or loss | ||
| Exchange differences on translation of foreign subsidiaries | (121) | 17 |
| Total comprehensive (loss)/income for the financial year | 1,284 | (4,116) |
| (Loss)/Profit attributable to owners of the Company, net of taxation | 1,405 | (4,133) |
| Total comprehensive (loss)/income attributable to owners of the Company | 1,284 | (4,116) |
| (Losses)/Earnings per share attributable to owners of the Company (cents) | ||
| Basic (losses)/earnings per share | 1.62 | (3.98) |
| Diluted (losses)/earnings per share | 1.62 | (3.98) |